Each year, the Department of Homeland Security (DHS) publishes its annual Yearbook of Immigration Statistics. The Yearbook contains a trove of data, with FY 2016’s Yearbook containing 41 tables published in a 115-page document. Helpfully, new tables are released as they become available throughout the year.
The first of FY 2017’s tables have been released on the DHS website. Tables 20-24 measure naturalizations to the United States. In the Department’s own words, “Naturalization confers U.S. citizenship upon foreign nationals who have fulfilled the requirements Congress established in the Immigration and Nationality Act (INA). After naturalization, foreign-born citizens enjoy nearly all of the same benefits, rights, and responsibilities that the Constitution protects for native-born U.S. citizens, including the right to vote.”
Observing trends in naturalization since the Immigration and Nationality Act of 1965 gives us a sense of how desirable U.S. citizenship actually is based on the total number of naturalizations, which have risen considerably since 1965.
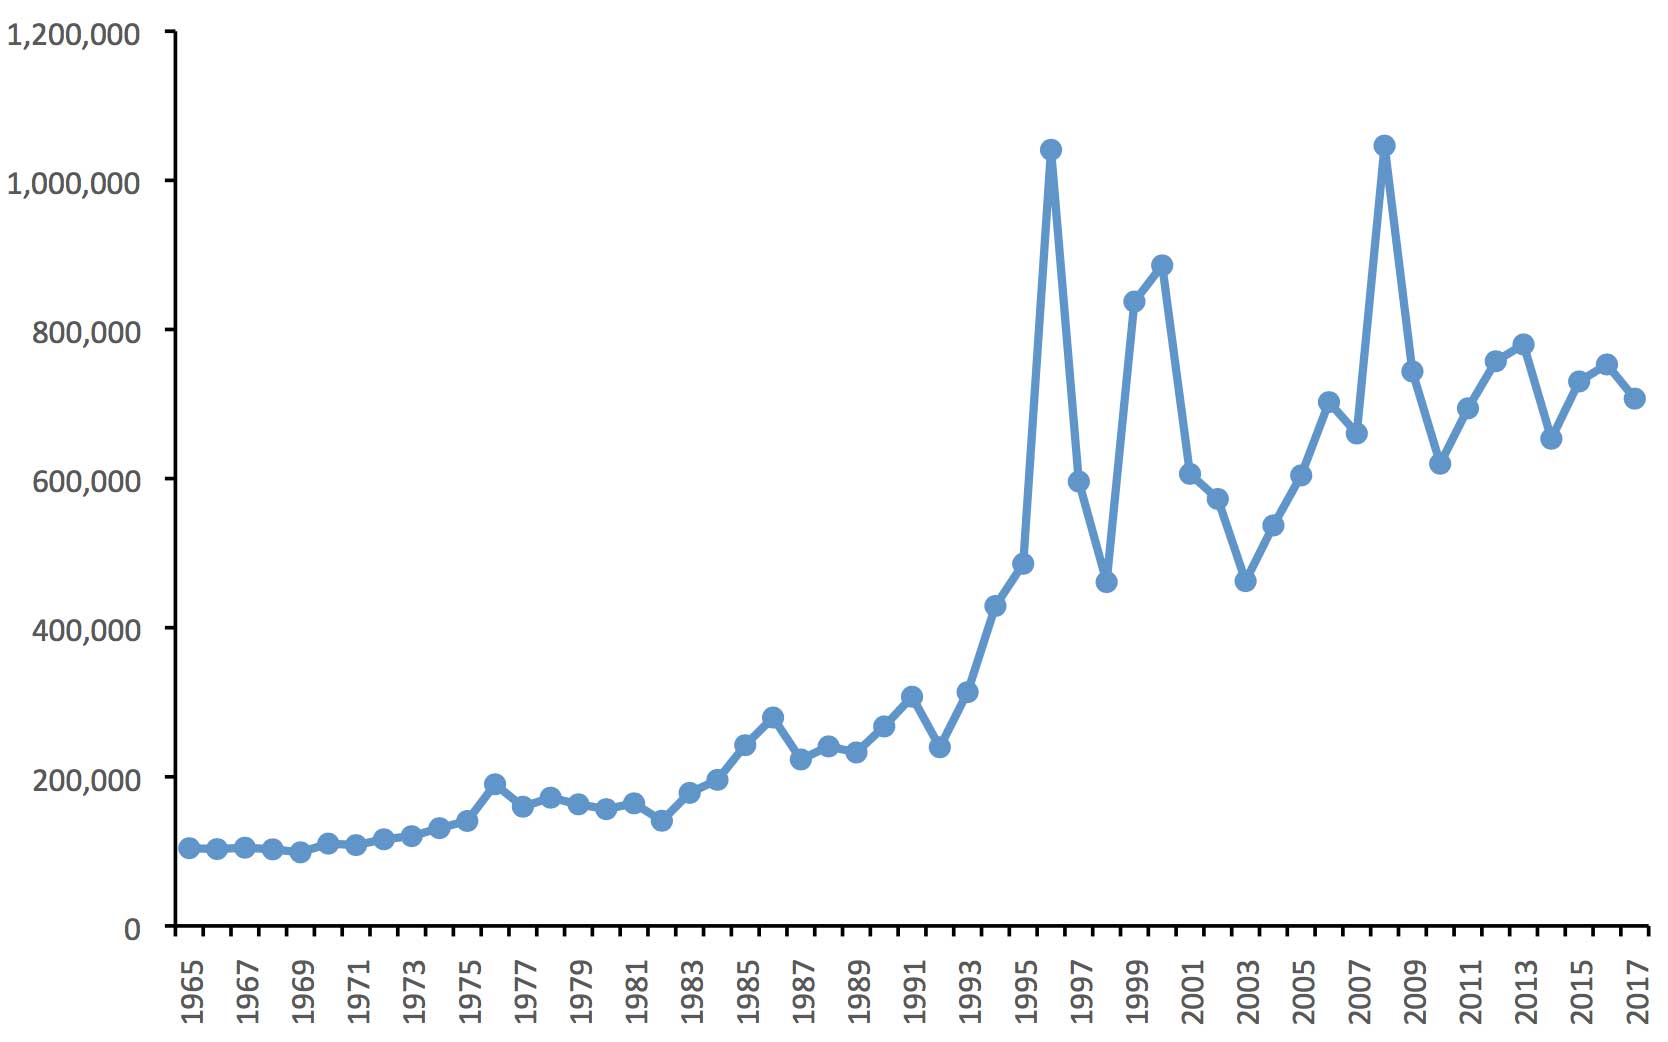
Between 1965 and 1985, naturalizations remained relatively stable at under 200,000 per year. From 1986 to 1995, they remained at least under 500,000 annually. Then, a period of great fluctuation began in 1996 and continued until 2009, when numbers soared to over one million in 1996 and 2008, but also dipped to below 500,000 in 1998 and 2003. Since 2009, naturalizations have stabilized somewhat between 600,000 and 800,000 per year.
In FY 2017, the U.S. naturalized 707,265 people, 6.5 percent fewer than in FY 2016. The United States has naturalized 7.49 million people in the last 10 fiscal years.
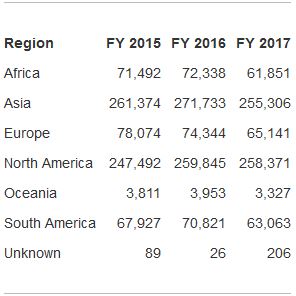
The following table shows how naturalizations from North America and Asia have dominated the overall totals in recent years. Individuals from these regions made up 72.6 percent of all naturalizations in FY 2017.
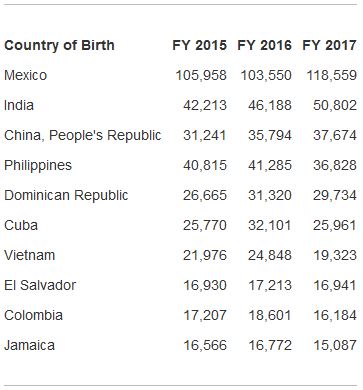
The following table shows the top-10 countries of birth for individuals who naturalized in FY 2015, 2016, and 2017. Mexico and India continue to drive naturalization numbers, with Mexico alone responsible for 16.8 percent of all naturalizations. The top-10 countries of birth represented 51.9 percent of all naturalizations across 201 unique places of birth.
The following table shows the top-five states of residence for people who naturalized in FY 2017. The fact that the number of naturalized persons in each state is high is not surprising, given that California, Texas, Florida, and New York are in the top-five states for total population in the country according to Census estimates. New Jersey is the eleventh most populous state.

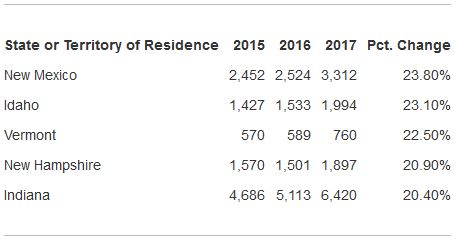
New Mexico, Idaho, Vermont, New Hampshire, and Indiana saw the greatest increase in naturalization totals between FY 2016 and 2017.
The following table shows persons naturalized by occupation in FY 2017. What is most striking is the number of individuals who are not employed in any capacity. Over 32.3 percent of individuals who naturalized are not working and are counted as those with the characteristics “no occupation/not working outside home,” “homemakers,” “unemployed,” and “retirees.”

Preston Huennekens serves as a Research Assistant at the Center for Immigration Studies (CIS), a research organization which focuses exclusively on immigration related issues.
Editor’s Note: This piece was originally published by the Center for Immigration Studies.
Original Post: https://www.cnsnews.com/commentary/preston-huennekens/naturalization-data-show-how-desirable-us-citizenship-actually
SIGN UP TO LEARN MORE

AVAILABLE NOW?
Speak to your EB-5 immigration specialist on WhatsApp.
![]()